
“everything in life moves in cycles. those who don’t LEARN FROM the past are doomed to repeat it.“


")
")


Discover our Combochart Tool
Our Combochart Tool allows you to analyze the technical part of the markets in an autonomous and interactive way.
You can choose from about 500 instruments on 4 different time frames and 30 indicators, between classics and proprietary.
Below you have all the indicators available, on all time frames on the S&P500 only.
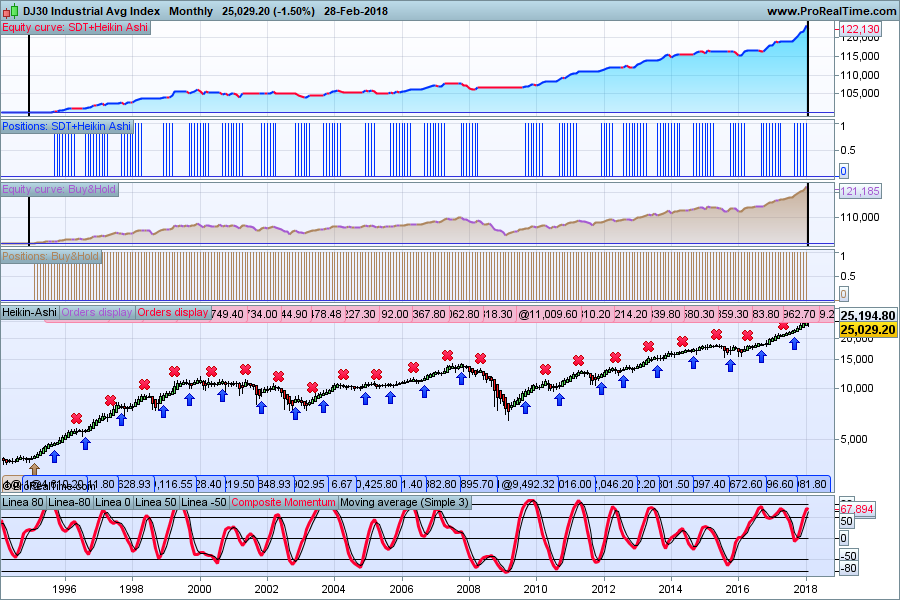
Beating the Dow – This ProRealTime monthly chart relates to one of our simple and slow quant long term models. The results since Jan. 1st 1995 prove that is possible to beat (slightly) the Dow Jones Industrial Index, without being always fully invested, without leverage and with a max drawdown of less than 8%. With a simple 1.5x leverage, results are sharply better with a max drawdown (on a monthly close basis) of 16%. Check the max drawdown of the Buy-and-Hold strategy in the same period (2000-2003 and 2007-2009 Bears). The model is actually long since September 1st 2017.
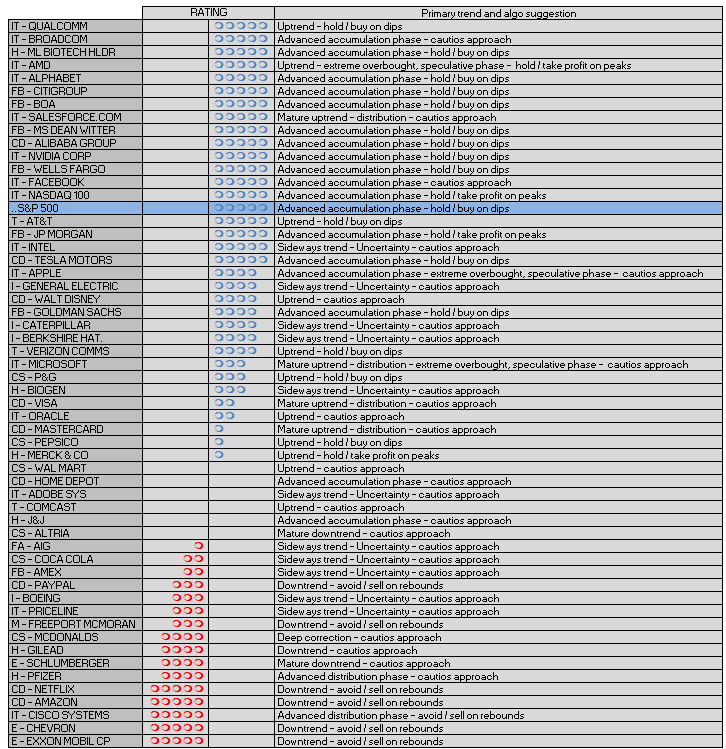
Our Rating Model – This table shows the rating of a selection of US Big Cap.
The rating model is based on a proprietary algorythm mixing trend, momentum and relative strength.
Last update: December 2019
Composite Momentum is available on many technical analysis platforms and software.
Ask your provider or look our post Construction and formulas


Home page
ultima modifica: 2016-05-29T23:15:27+00:00
da